Sonoco Products Co. (SON)
NYSE · Consumer Cyclical
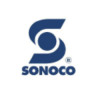
Sonoco Products Co. Total Liabilities 2008–2025
Sonoco Products Co. annual total liabilities history from 2009 to 2025. Total liabilities is the combined debt and financial obligations a company owes to creditors.
- Sonoco Products Co. total liabilities as of December 31, 2025: 7.53B, a 26.33% decrease year-over-year.
- Sonoco Products Co. total liabilities for 2025 were 7.53B, a 26.33% decrease from 2024.
- Sonoco Products Co. total liabilities for 2024 were 10.22B, a 114.73% increase from 2023.
- Sonoco Products Co. total liabilities for 2023 were 4.76B, a 4.55% decrease from 2022.
- Sonoco Products Co. total liabilities for 2022 were 4.99B.
Total Liabilities
ANNUAL · $B
YEAR-OVER-YEAR GROWTH · %
| Sonoco Products Co. Annual Total Liabilities (Millions of US $) | |
|---|---|
| 2025 | $7,531 |
| 2024 | $10,222 |
| 2023 | $4,760 |
| 2022 | $4,987 |
| 2021 | $3,236 |
| 2020 | $3,378 |
| 2019 | $3,324 |
| 2018 | $2,824 |
| 2017 | $2,851 |
| 2016 | $2,391 |
| 2015 | $2,501 |
| 2014 | $2,699 |
| 2013 | $2,283 |
| 2012 | $2,687 |
| 2011 | $2,581 |
Sonoco Products Co. Total Liabilities — FAQ
Sonoco Products Co. (SON) total liabilities over the last 18 years — annual and quarterly figures with year-over-year growth and charts.
Where can I see SON's total liabilities history?
The chart and table above show Sonoco Products Co.'s total liabilities by year and by quarter, including the growth rate.