374Water Inc. (SCWO)
NASDAQ · Industrials
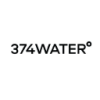
374Water Inc. Cash Flow 2010–2025
| Dec 2025 | Dec 2024 | Dec 2023 | Dec 2022 | Dec 2021 | Dec 2020 | Dec 2019 | Dec 2018 | Dec 2017 | Dec 2016 | Dec 2015 | Dec 2014 | Dec 2013 | Dec 2012 | Dec 2011 | Dec 2010 | |
|---|---|---|---|---|---|---|---|---|---|---|---|---|---|---|---|---|
| Operating Activities | ||||||||||||||||
| Operating Cash Flow | -14.3M | -10.6M | -9.0M | -4.9M | -1.8M | 64,759 | -287,449 | 157,146 | 271,550 | -146,754 | -38,871 | -337,480 | -314,257 | -1.0M | -1.5M | -298,273 |
| Depreciation & Amort. | 752,026 | 226,039 | 85,816 | 67,573 | 46,050 | 0 | 5,633 | 19,963 | 36,446 | 32,371 | 76,579 | 236,455 | 231,658 | 171,110 | — | — |
| Investing Activities | ||||||||||||||||
| Capital Expenditure | 1.9M | 554,942 | 105,990 | 144,567 | 1,190 | 0 | — | — | — | — | — | 13,590 | -57,720 | — | 11,193 | 3,538 |
| Free Cash Flow | -16.2M | -11.1M | -9.1M | -5.1M | -1.8M | 64,759 | — | — | — | — | — | -351,070 | -371,977 | — | -1.5M | -301,811 |
| Financing Activities | ||||||||||||||||
| Dividends Paid | — | — | — | — | — | — | — | — | — | — | — | — | — | — | — | — |
| Stock Buybacks | — | — | — | — | — | 300,000 | — | — | — | — | — | — | — | -320,381 | — | — |
374Water Inc. Cash Flow — FAQ
374Water Inc. (SCWO) cash flow over the last 16 years — annual and quarterly figures with year-over-year growth and charts.
Where can I see SCWO's cash flow history?
The chart and table above show 374Water Inc.'s cash flow by year and by quarter, including the growth rate.