The Hartford Insurance Group, Inc. (HIG)
NYSE · Financial Services
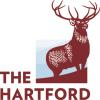
The Hartford Insurance Group, Inc. Price to FCF Ratio 2006–2026
Price to free cash flow (P/FCF) ratio for The Hartford Insurance Group, Inc. (HIG): market cap divided by trailing twelve-month free cash flow. As of March 31, 2026 it is 6.58.
From: 06/30/2009To: 03/31/2026
Stock Price
TTM Free Cash Flow
Price to FCF
The Hartford Insurance Group, Inc. Price to FCF Ratio — FAQ
The Hartford Insurance Group, Inc. (HIG) price to fcf ratio over the last 19 years — annual and quarterly figures with year-over-year growth and charts.
Where can I see HIG's price to fcf ratio history?
The chart and table above show The Hartford Insurance Group, Inc.'s price to fcf ratio by year and by quarter, including the growth rate.